Describe the patient


Everything lives on one screen: you type on the left, answers appear on the right. Start at the top of the left rail and work down. You enter five things about the patient — age, sex, total body weight, height, and serum creatinine — and the tool immediately derives the rest.
Watch the boxes that fill themselves in. From height and sex it computes IBW (ideal body weight) and AdjBW (adjusted body weight); from weight and height, BMI. It then picks a dosing weight and says which one it chose and why. In the screenshot: IBW 73.2 kg, AdjBW 75.9, BMI 25.2, and it dosed on total body weight because the patient is not obese.
Why the weight matters so much. Aminoglycosides distribute into lean tissue, not fat. Dosing an obese patient on total body weight would overshoot badly, so above roughly 20% over IBW the tool switches to AdjBW. You can override the choice with the TBW / IBW / AdjBW buttons if you disagree — but the tool states its reasoning so you can check it first.
Then pick drug and indication. The indication sets the target peak and trough band — serious Gram-negative infection, cystitis, Gram-positive synergy, and NTM all aim at different numbers. Infusion duration defaults to 0.5 h (30 minutes), the institutional standard. It is not cosmetic: it changes the peak, so correct it if your patient's infusion runs longer.
The creatinine trap. Serum creatinine comes from muscle. A frail, cachectic or non-ambulatory patient makes less of it, so their creatinine looks reassuringly low and CrCl looks falsely high — which would make you dose too much, too often. If that describes your patient, tick the boxes under Low muscle mass / cachexia. The tool then changes how it estimates clearance and says so.
Read the starting dose
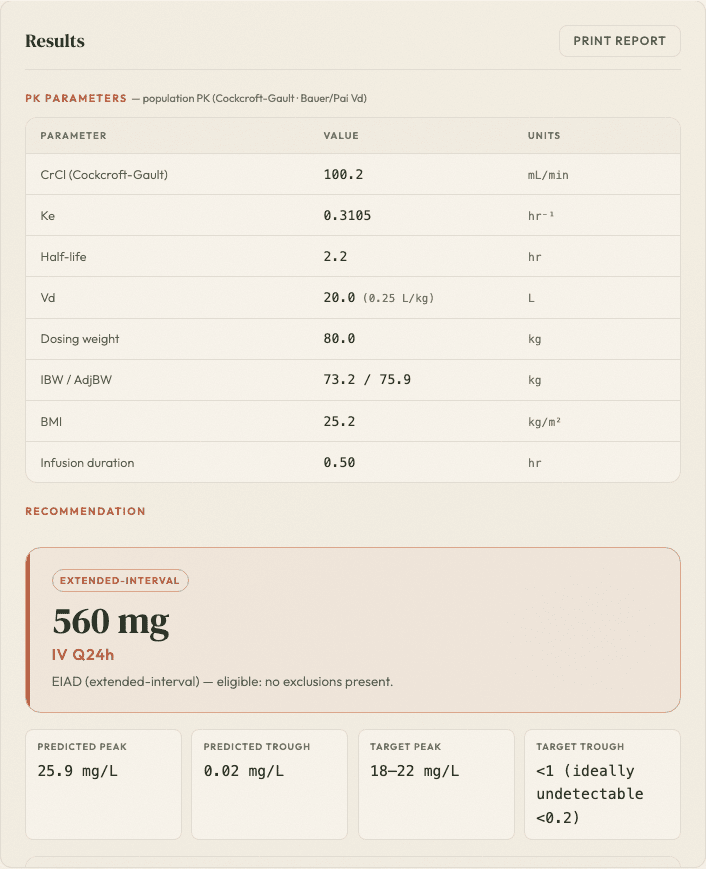
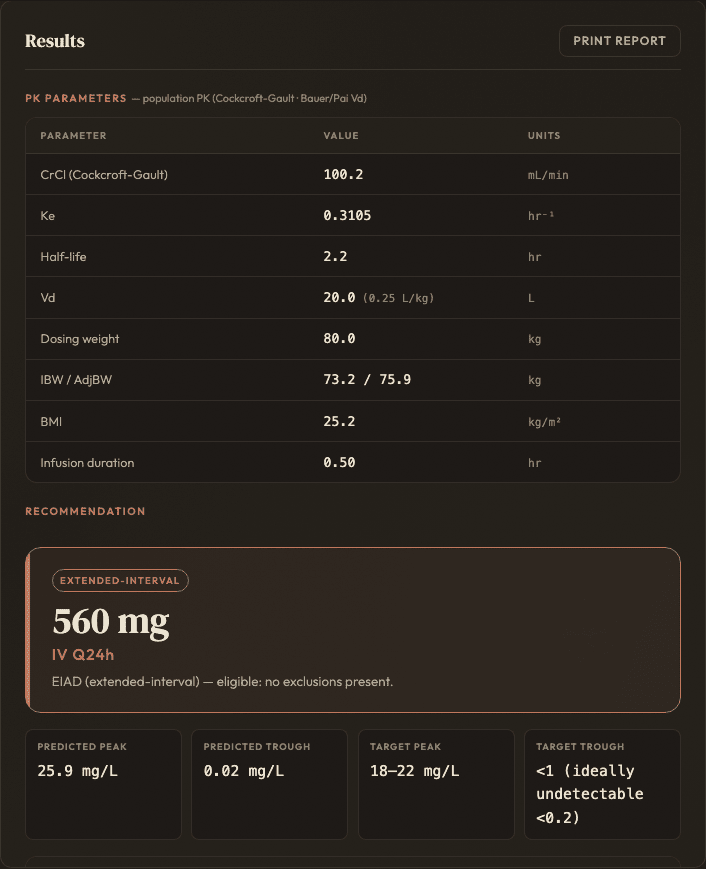
Press Calculate and the right pane fills in. Read it in three passes: the parameters it derived, the dose it recommends, and the four chips that tell you whether that dose lands where you want it.
The PK parameters table is the population estimate — what an average patient with this CrCl and weight would do. Here: CrCl 100.2 mL/min, Ke 0.3105 /hr, half-life 2.2 h, Vd 20.0 L. Nothing has been measured in this patient yet, so treat these as a starting hypothesis, not a fact.
The recommendation. The badge says which strategy was chosen — here EXTENDED-INTERVAL, with the reason underneath (“eligible: no exclusions present”). Then the dose and interval: 560 mg IV Q24h. If the patient had been excluded from extended-interval dosing — poor renal function, Gram-positive synergy, pregnancy — the badge and the reason would say so instead.
The four chips are the check. Predicted peak and predicted trough are what this dose should produce; target peak and target trough are what the indication asks for. Read them as a pair.
One thing that will confuse you. In the screenshot the predicted peak reads 25.9 mg/L against a target of 18-22, which looks like a failure. It is a difference of reference point: the predicted peak shown is the concentration at the end of the infusion, while the target band is defined on the distributed peak about 30 minutes later, once the drug has spread out. The distributed value here is about 22 — at the top of target. Aiming a dose at the end-of-infusion number would under-dose the patient. This inconsistency in the display is known and under review.
Check the reasoning
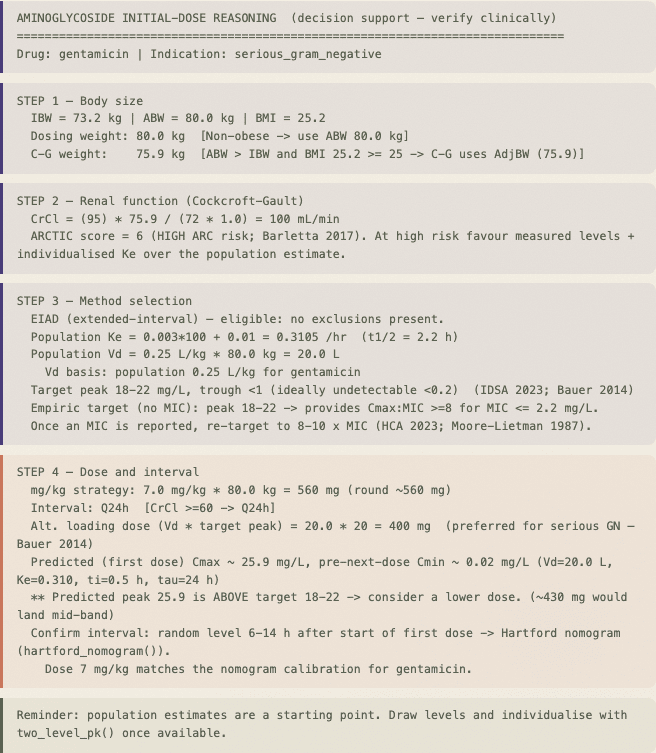
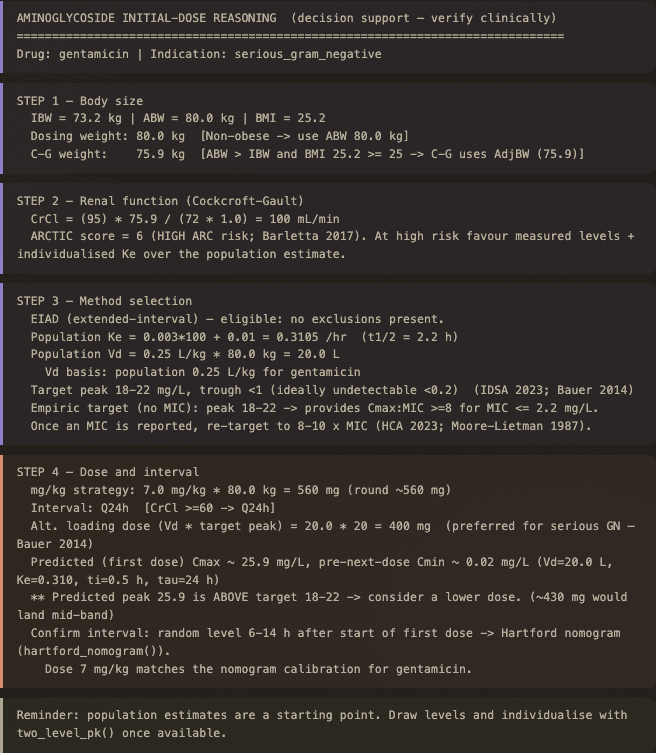
Below the recommendation the tool prints its complete working — every step, in order, with the actual arithmetic. This is the part to read while you are learning, and the part to keep reading afterwards.
Follow it top to bottom. Body size, then renal function, then method selection, then dose and interval, then the target check. Each line shows the numbers that went in, so you can recompute any step by hand. If a line surprises you, that is the line to question.
Lines beginning ** are warnings, and they are the most valuable thing on the
screen. They fire for things like a predicted trough above target, a volume of distribution that is
physiologically implausible, an organism whose MIC cannot be covered at a safe dose, or a nomogram
being used outside the dose it was calibrated for.
Never submit a dose you cannot explain. The trace exists so that the answer is checkable rather than trusted. If the tool and your own arithmetic disagree, assume the tool needs questioning — and tell whoever maintains it.
Enter measured levels
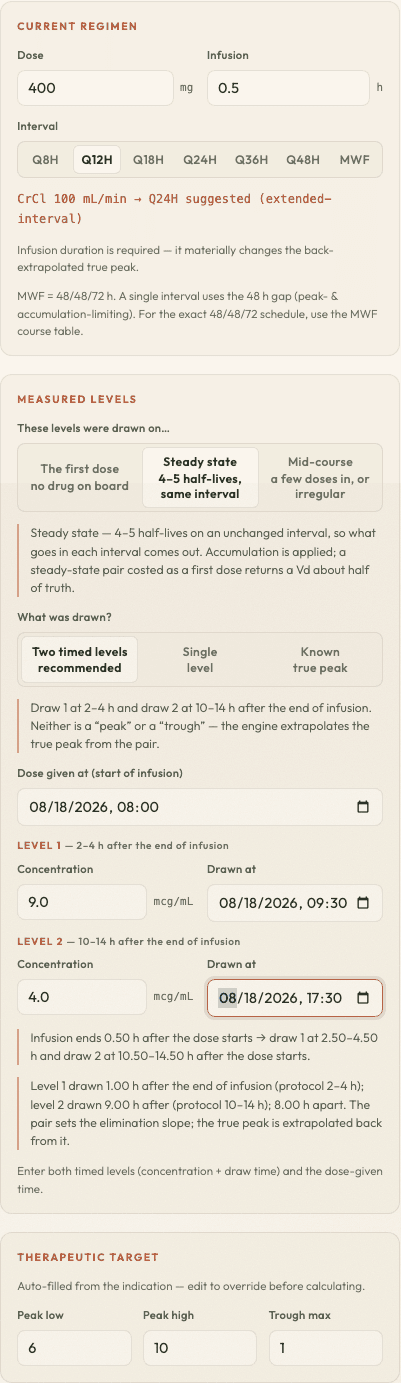
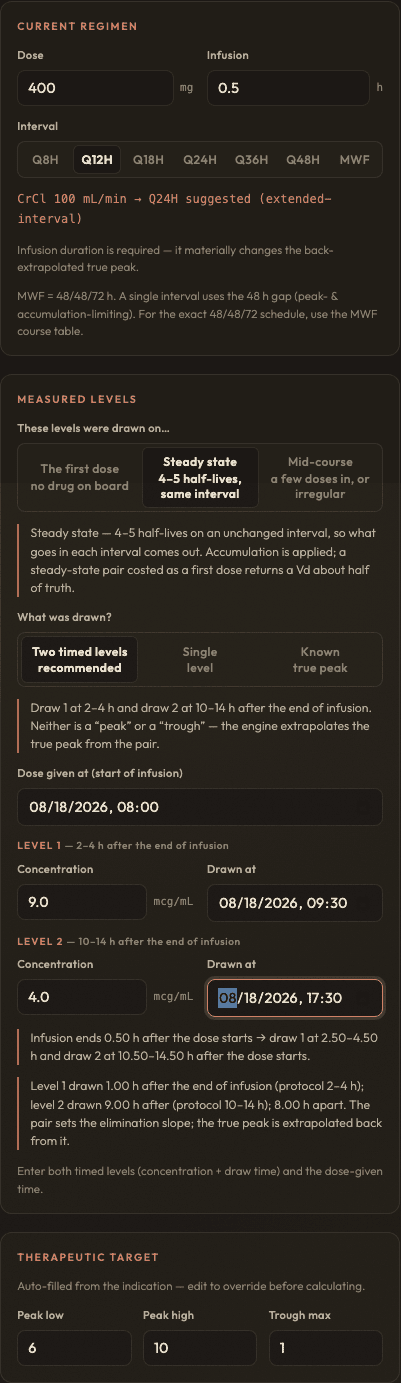
Once the patient has had a dose and you have drawn concentrations, switch to the Adjust from levels tab. Now the tool stops guessing from population averages and measures this patient. Enter the regimen they are actually on, then the levels.
“These levels were drawn on…” is the question students get wrong most often, and it changes the answer a lot. Choose The first dose when no drug was on board beforehand. Choose Steady state when the patient has been on an unchanged interval for four to five half-lives, so what goes in each interval comes out. Choose Mid-course when they are a few doses in, or the spacing changed.
Why it matters: a steady-state pair costed as though it were a first dose returns a volume of distribution roughly half of the truth — and therefore a dose roughly half of what the patient needs. The tool cannot work this out for itself: leftover drug from an earlier dose decays at exactly the same rate as the current dose, so the levels look identical either way. Only you know the schedule.
Two timed levels is the recommended mode. Draw the first 2-4 h after the end of the infusion and the second 10-14 h after. Neither one is “the peak” or “the trough” — the tool uses the pair to measure the elimination slope and works the true peak and trough out from it. As you type the draw times it tells you how far after the infusion each landed and whether that is inside the protocol window.
The other two modes are there when that is not what you have: Single level (say which it is — post-infusion or pre-dose) and Known true peak if a peak has already been back-extrapolated for you. Two levels are more precise, because a single level cannot separate how fast the patient clears the drug from how widely they distribute it.
Read the adjusted dose
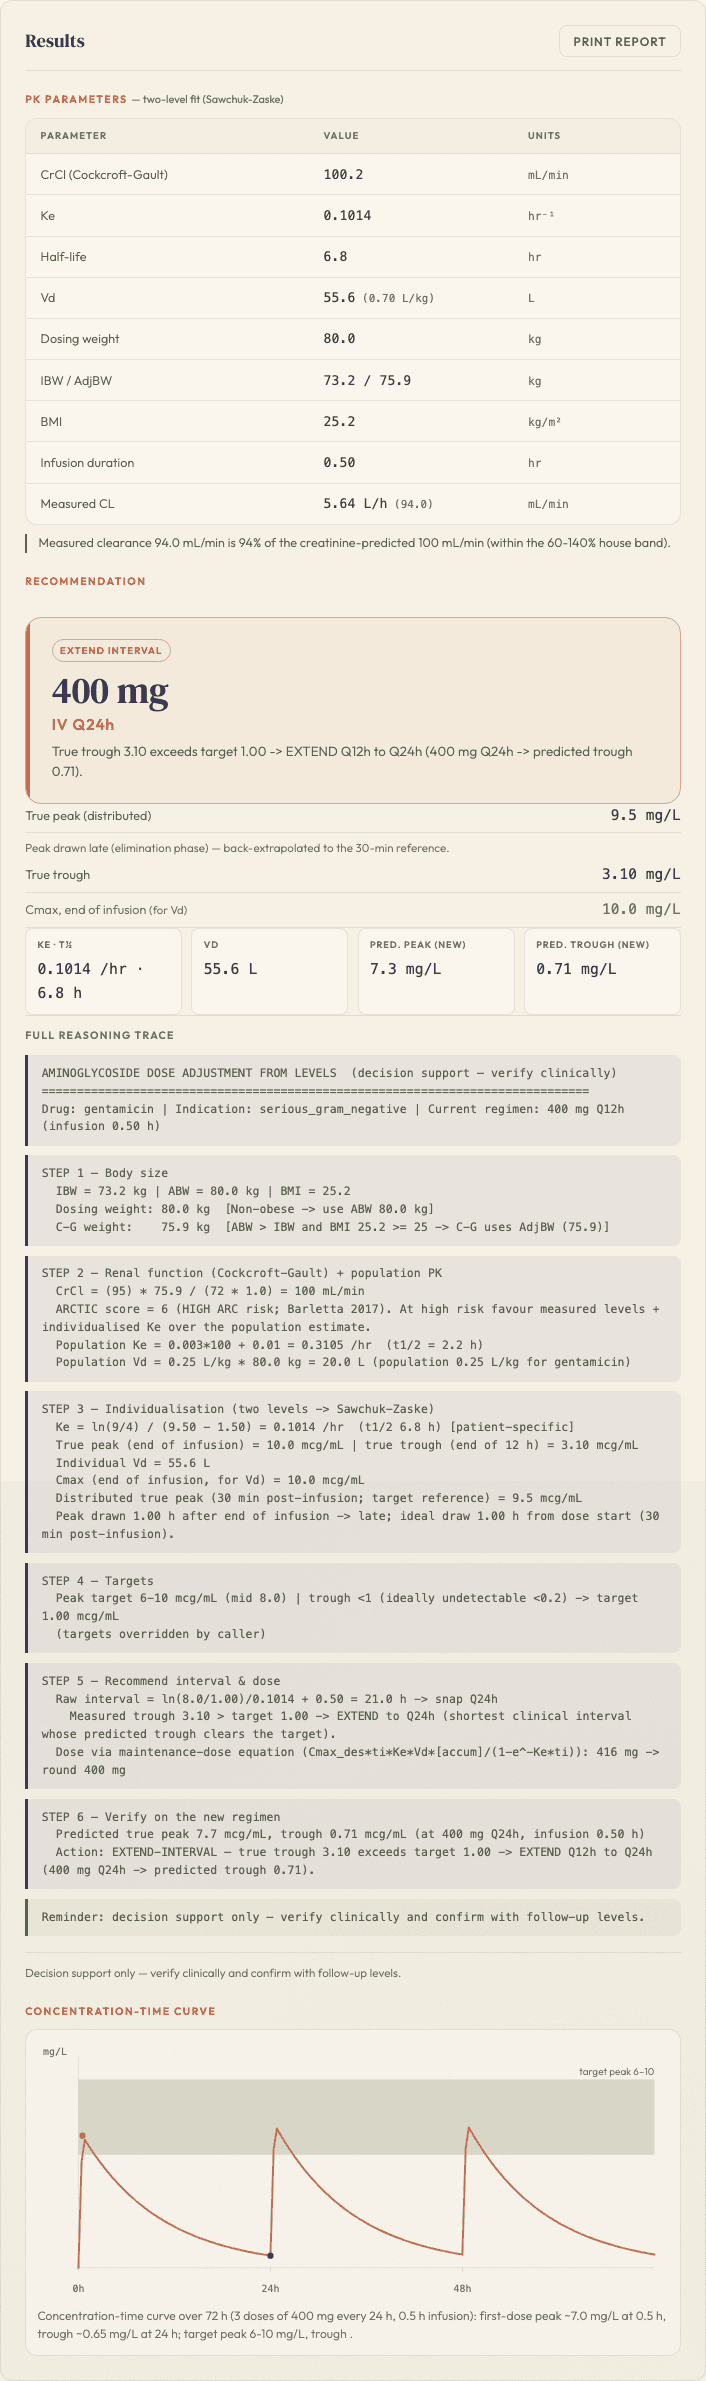
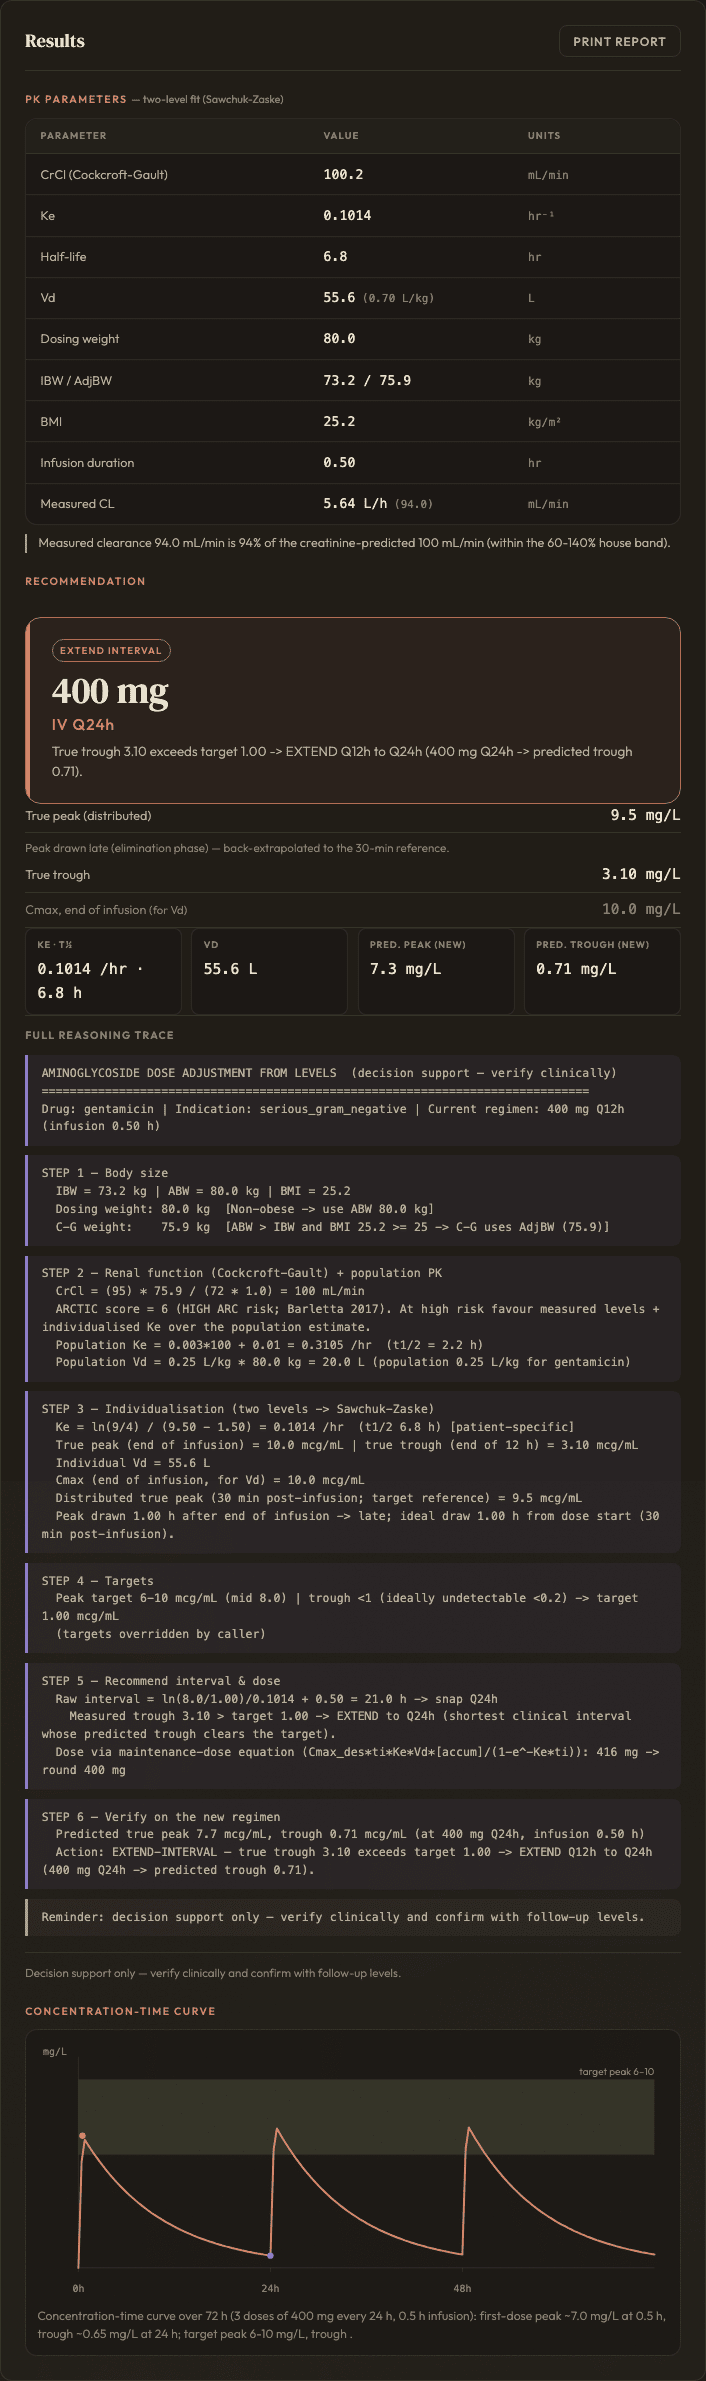
Now the numbers belong to your patient rather than to a population. The tool reports the elimination rate and volume it measured, the true peak and trough those imply, and the dose and interval that would bring both into target.
Compare measured against predicted. If the measured clearance is far from what creatinine predicted, that is a finding in itself — and usually the most clinically important thing on the screen. The tool flags large discrepancies and names the likely reason.
The action tells you which lever to pull. A peak below target means increase the dose. A trough above target means lengthen the interval — and the tool names the interval to move to, having checked that the trough actually clears at the rounded dose it is recommending. If no interval clears it, the recommendation becomes dose by level: give one dose, then re-dose only when a measured level has fallen below target.
Peak problems and trough problems have different fixes. A high trough is not fixed by cutting the dose — that lowers the peak you need for killing while barely shortening the time above the toxic threshold. Lengthen the interval instead. This is the single most common reasoning error in aminoglycoside TDM.
Bayesian precision
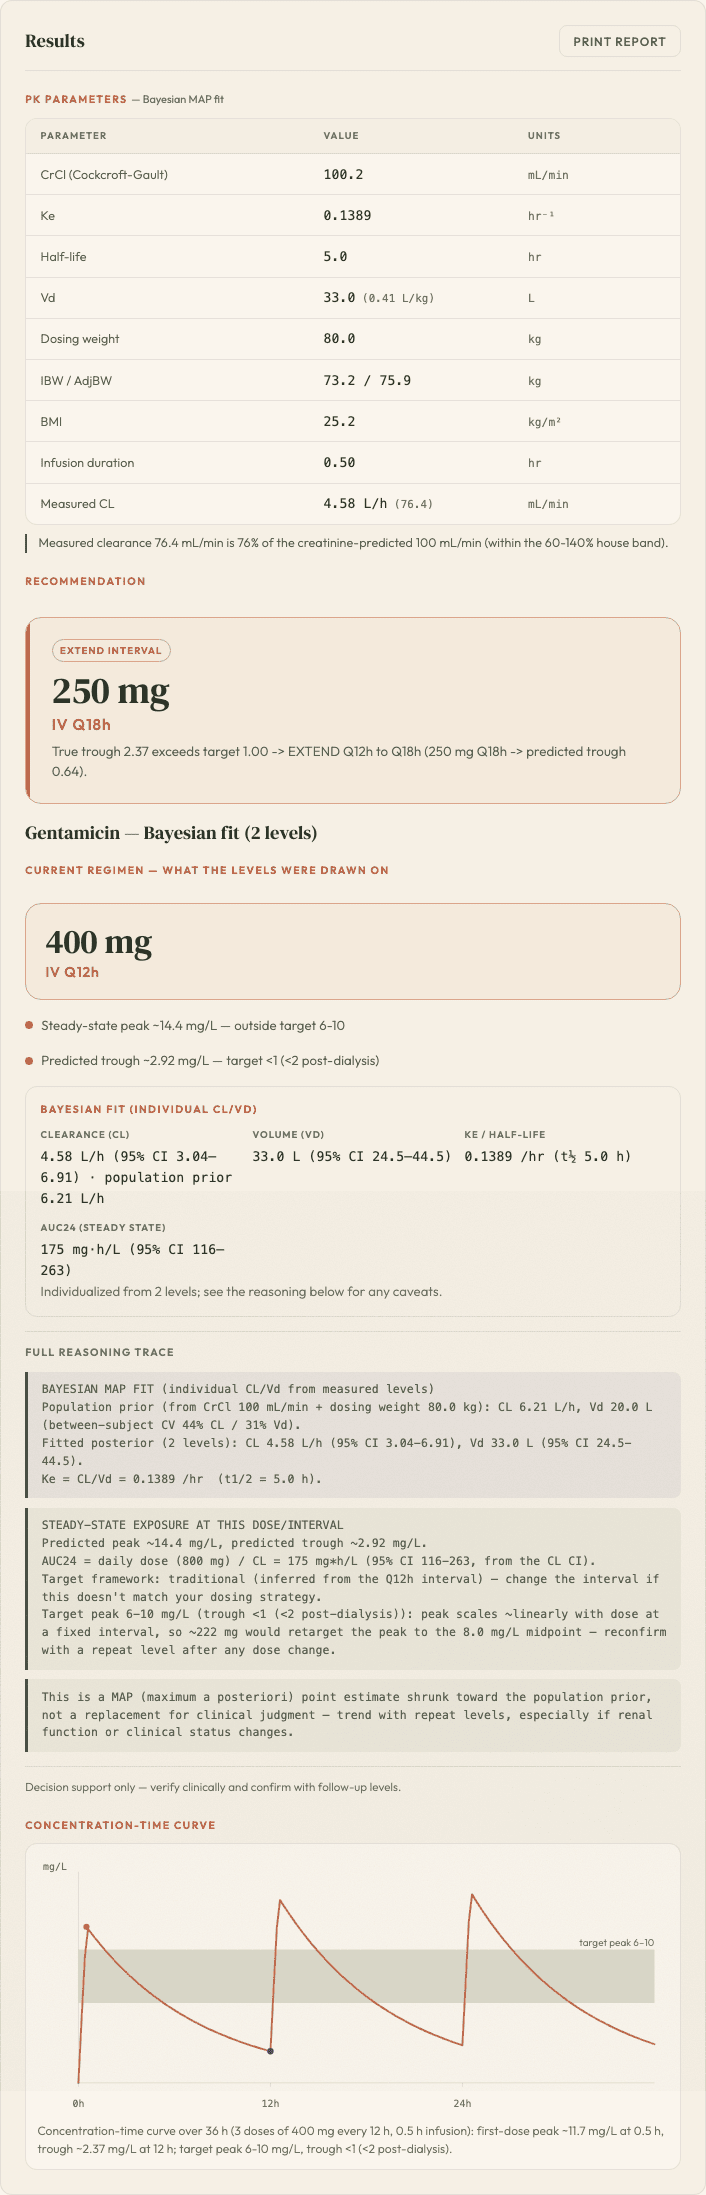
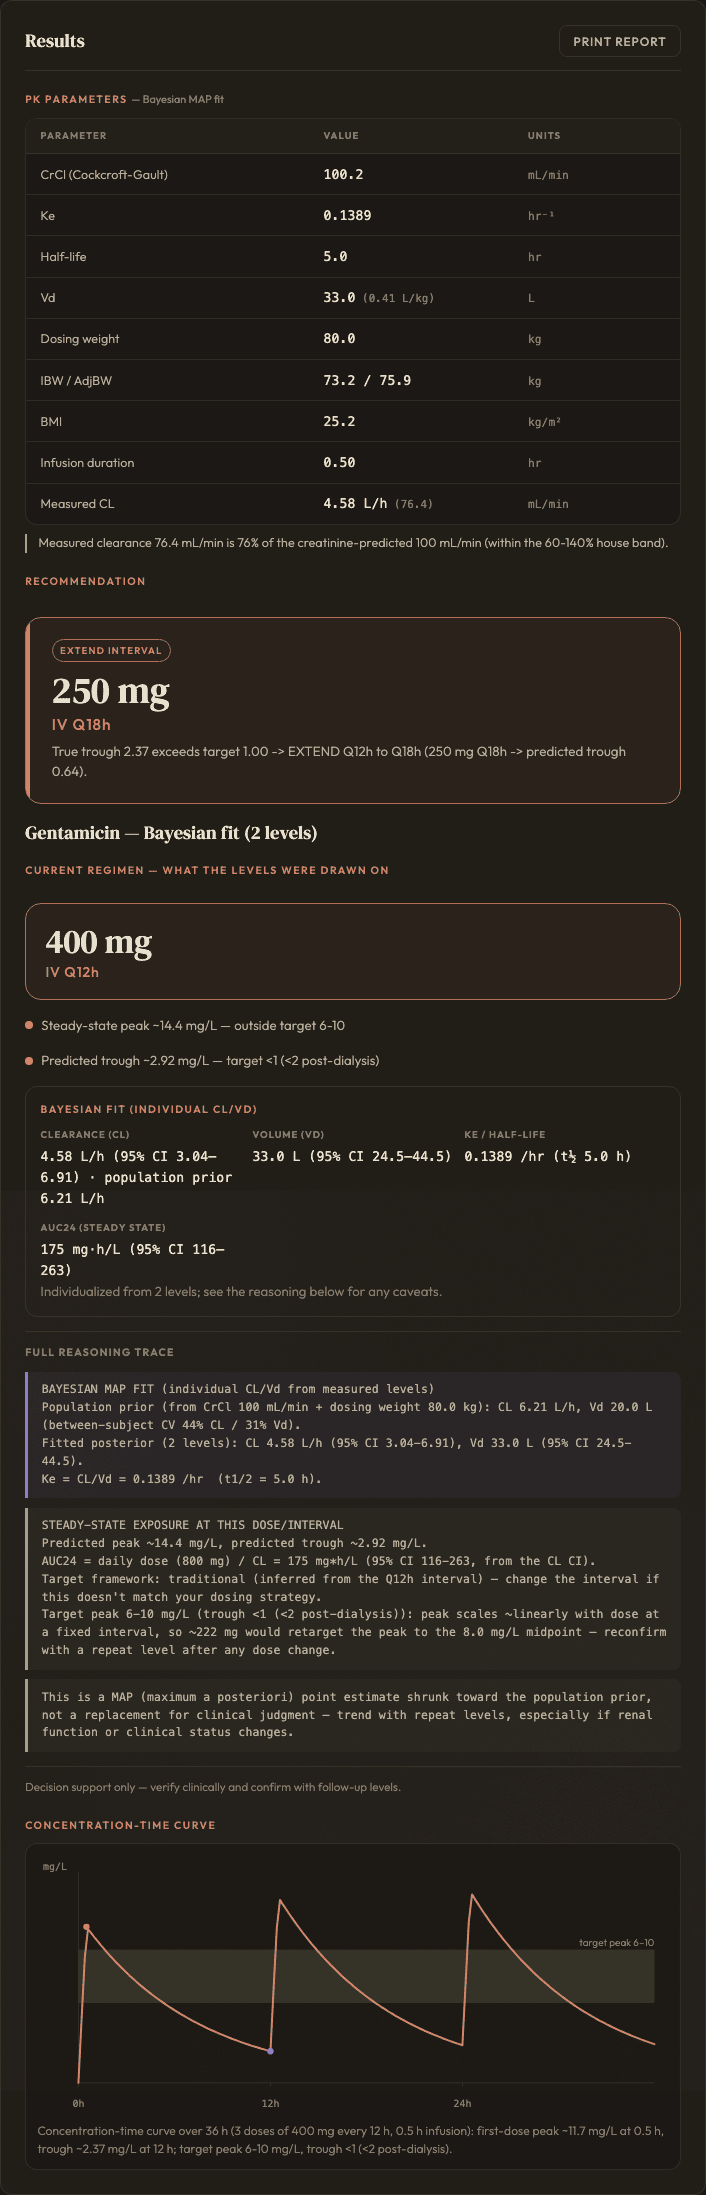
The Bayesian precision tab answers the same question a different way. Instead of using your levels alone, it starts from what a population like your patient usually does and lets the measurements pull that estimate toward the truth.
Prior, then posterior. The prior is the population expectation from CrCl and weight. The posterior is what remains after your measurements have had their say. With two good timed levels the data dominates and the answer is close to the two-level fit; with a single level the estimate stays much closer to the prior — which is exactly why one level is weaker evidence.
It shows both, side by side, along with confidence intervals and AUC₂₄ (total exposure over a day). When the fitted clearance and the creatinine-derived prior disagree by a lot, the tool says so — that gap is the clinical signal.
The fourth tab, MWF course, is for a patient with several dated doses at irregular spacing — a thrice-weekly NTM schedule, or any course where the timing was not uniform. It fits the real schedule rather than assuming a single dose, so use it whenever more than one dose has been given before the levels. The levels tab will point you here when it detects that situation.